Our Approach & Indicators
A vision of the planet, brought to life
Our team of scientific experts have been collecting, curating and integrating critical environmental and societal data at scale for over 40 years.
This covers different Earth systems and subsystems in locations all over the world, including our planet’s land masses, oceans and icecaps; cities and urbanized regions; deserts, forests and mountains – amounting to petabytes of data.
Earth Knowledge Science Council includes co-authors of;
Intergovernmental Panel on Climate Change (IPCC);
Intergovernmental Panel on Biodiversity & Ecosystem Services (IPBES);
U.S. National Climate Assessments (NCA); and
IPBES Business & Biodiversity Report
Integrated Planetary Intelligence®
Unlike other platforms, our modeling accounts for the interaction of Earth and atmospheric systems and human responses. Earth Knowledge’s approach to modeling and projection of changes in future Earth and climate conditions provides an unprecedented level of credibility and detail. This “system of systems” approach sets a new standard to characterize past, present, and potential alternative future environmental processes and conditions, foundational for achieving Integrated Planetary Intelligence®. Some of these processes are enhanced with Artificial Intelligence (AI) and Machine Learning (ML). Our Science Council follows a robust curation process and principles to ensure that the highest quality Earth systems models are incorporated into our platform. Models are calibrated and evaluated to determine how well they represent natural conditions over the 125-year historical period.
The culmination of our Integrated Planetary Intelligence® platform is the Earth Knowledge Twin, which continually assesses changing Earth systems and characterizes information in the context of Global Change and Sustainability Indicators. Earth Knowledge’s Twin leverages a “digital twin” of the Earth integrating authoritative data and models of the Earth’s interconnected systems, containing over 70 billion cells of global geospatial data describing characteristics from the subsurface of the geosphere to the upper altitudes of the atmosphere. The twin represents the conditions on the landscapes and seascapes of the planet at multiple spatial and temporal resolutions. These varying conditions range from approximately 125 years into the past and approximately 75 years into the future.
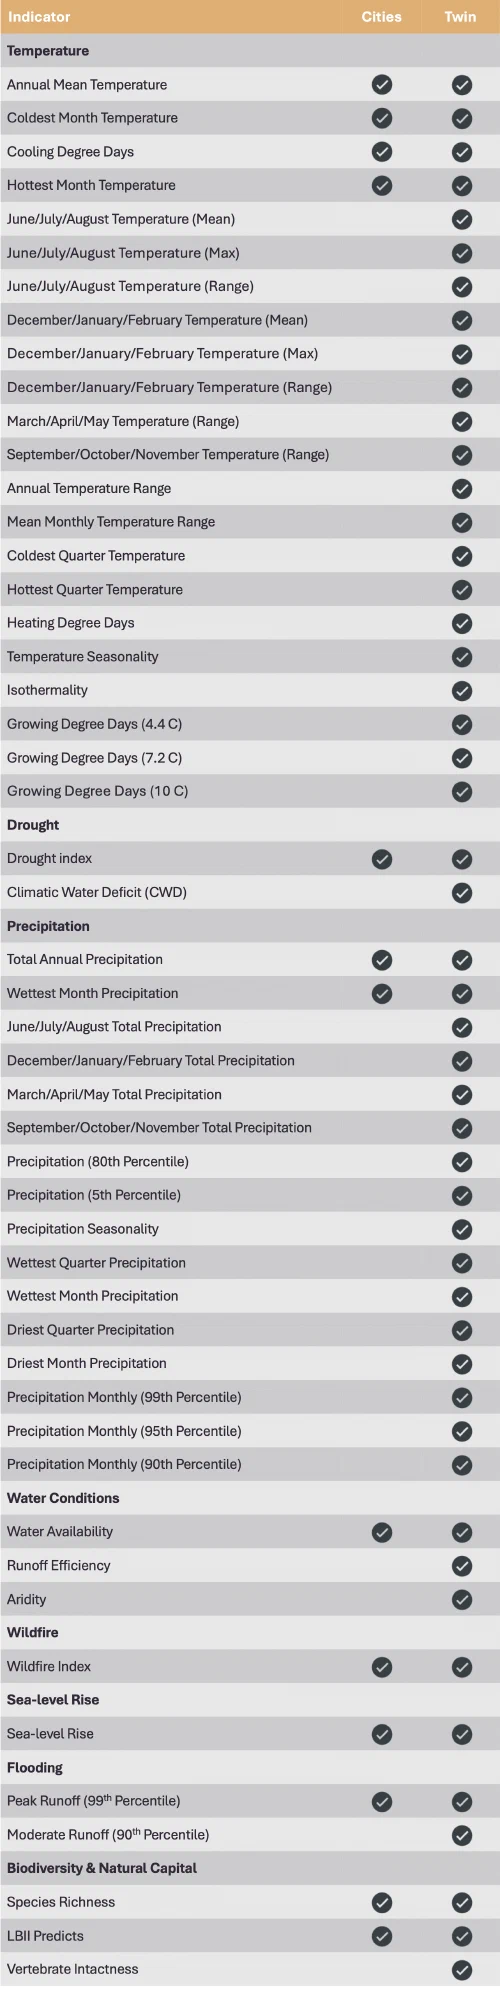
The Earth Knowledge Twin translates scientific data, information, and Earth-systems models into 50+ indicators (Earth Knowledge Indicators) related to the direct drivers of global change and the commonly described three pillars of sustainability (Natural Capital, Social Capital, and Economic Capital). The indicators help assess global change and sustainability actions and provide a quantitative way to measure impacts and related potential risks and identify and assess opportunities at any location on the globe.
Earth Knowledge’s direct drivers of global change which lead to biodiversity loss and habitat degradation include climate change, pollution, invasive species and disease, over-exploitation of natural resources, and land and sea conversion. Earth Knowledge focuses on the same five drivers of global change that are used by the IPBES in their global assessment of biodiversity and ecosystem services (IPBES, 2019), the WWF in their Living Planet Database and Report (WWF, 2020), the WEF in their Nature Risk Rising Report (2020), and which were originally defined by the IUCN in their Standard Lexicon of Biodiversity Conservation (Salafsky and others, 2008).
Earth Knowledge’s Indicators have been developed using the DPSIR (Driver-Pressures-State-Impact-Response) Framework. This is an analytical indicator hierarchy that can enable decision makers to address the environmental impacts driven by social, economic, and political choices. The DPSIR Framework was originally developed by the Organization for Economic Cooperation and Development (OECD, 2003) and ultimately adopted by the UN Environmental Programme in many environmental assessments conducted by that body including the Global Environmental Outlook (UNEP, 2012; 2019) and Global Biodiversity Outlook (UNCBD, 2020).
This fundamental alignment of the Earth Knowledge’s Indicators Framework to the important work of these authoritative bodies is foundational. It provides consistency in process and language so that more direct translation can be made between science conclusions and global change and sustainability outcomes evaluated by financial institutions.
Earth Knowledge Indicators are structured to identify and project both discrete environmental processes and interrelated resulting conditions of global change on biodiversity and other aspects of natural capital. Each Indicator is a composite measure of different conditions aggregated at multiple spatial resolutions at different time periods for specific locations across a landscape or a seascape.

Frank D’Agnese, Co-founder, President and CTO
“For over 30 years, I have spent my life and career studying and developing transdisciplinary models which replicate our earth, integrating science disciplines from the subsurface to atmosphere. The goal has always been to better inform the critical intelligence required for sustainable decisions. This system of systems approach and Integrated Planetary Intelligence® is the bedrock of all of our work and the Earth Knowledge Twin.
This unique approach provides unparalleled solutions for mitigating global change risks, harnessing opportunities and building adaptation and resilience strategies for businesses and government agencies, as well as for healing our planet.”
Our Scientific Methodology
Earth Knowledge generates its twins by constructing and running numerous Earth system and Earth subsystem process modelling codes to characterize past, present, and potential alternative future environmental processes and conditions. Where required, lower resolution (coarser) data or model outputs are appropriately downscaled using spatial, statistical, or dynamical downscaling methods that are suitable for the data and the model from which the data originated. Any data downscaling is noted within the source Indicator paper in our knowledgebase, including method and suitability.
Process models used to describe biophysical processes at multiple spatial and temporal scales must meet several key criteria to be used. These include that the biophysical process models must:
- be developed or available in the public domain;
- have undergone significant peer-review in many different journals and/or organizations;
- be used in many different landscape environments and settings;
- be used in many different geographic locations;
- be applicable at multiple spatial and temporal scales; and
- be used by a broad user community.
For each Earth system and Earth subsystem model, Earth Knowledge identifies and selects authoritative data sources based on:
- global uniformity and extent [global, regional, locally specific data set];
- date of collection [or future projection];
- spatial resolution;
- methodology of data acquisition and development;
- official verification of the data developers and their organization; and
- assessment of their source organization’s quality assurance, quality control, procedures.
- Candidate source datasets are profiled, qualified, and sampled to establish their suitability for acquisition and processing. Earth Knowledge Data and Content Experts assess these requirements before acquiring and incorporating the datasets into our cloud-based operational data store.
Once the models are calibrated and evaluated to determine how well the models represent natural conditions over the 125-year historical period, the models are then re-run under varying conditions that represent different potential future states that may occur as a result of climate change and other forms of global change.
Future projections are calculated beginning in 1950 and simulated through to 2100. The overlap period from 1950 through 2020 is used so that there is sufficient repetition in the historical model and the forward-looking projections to determine the potential for any model bias that could exist that may be introduced from field observation data.
Our Indicators
An important way to track and communicate the effects of change in climate and natural capital is through the use of indicators.
A climate or nature indicator is a measurable variable used to represent an aspect of the climate or ecosystem, which can provide insights into the past, present, or future state of the climate.
Earth Knowledge Indicators for each variable represent:
- a change or trend: the trend of (or change in) certain environmental or societal conditions (e.g., temperature or precipitation) most often compared relative to a baseline time period, normalized to scale representing exposure from –100 to 100;
- within a period of time: the indicator trend is examined over a specified period of time (monthly, annual, decadal); and
- at a specified location or region: for a given location at a specified resolution (5km, 1km, 250m)
For example: the state (an absolute value or a metric, e.g., aridity, drought index, concentrations or emissions of a greenhouse gas, many of the biodiversity indicators) at a given location and time.
Indicators are generally designators of change relative to a baseline time period, but for some (and sometimes because of special user needs) indicators can be represented in terms of their state at the given location and time period. Climate and nature capital indicators provide evidence of these changes and their impacts on people, infrastructure, and the environment.
Natural capital (the stock of natural resources, which includes the geology, soils, air, water and all living organisms, including ecosystems and biodiversity) indicators specifically help us describe:
- changes in state, such as habitat loss or presence of invasive species, and changes in land use or water resources;
- the state of species and ecosystems, such as the health of species or integrity of ecosystems;
- the results of conservation measures, such as the protection of important biodiversity areas; and/or
- benefits to people, such as the ecosystem services that freshwater provides.
Indicators can range in scale from local to regional as needed and are grouped thematically.
References
IPBES (2019): Summary for policymakers of the global assessment report on biodiversity and ecosystem services of the Intergovernmental Science-Policy Platform on Biodiversity and Ecosystem Services. S. Díaz, J. Settele, E. S. Brondízio E.S., H. T. Ngo, M. Guèze, J. Agard, A. Arneth, P. Balvanera, K. A. Brauman, S. H. M. Butchart, K. M. A. Chan, L. A. Garibaldi, K. Ichii, J. Liu, S. M. Subramanian, G. F. Midgley, P. Miloslavich, Z. Molnár, D. Obura, A. Pfaff, S. Polasky, A. Purvis, J. Razzaque, B. Reyers, R. Roy Chowdhury, Y. J. Shin, I. J. Visseren-Hamakers, K. J. Willis, and C. N. Zayas (eds.). IPBES secretariat, Bonn, Germany. 56 pages.
IPBES (2019), Global assessment report of the Intergovernmental Science-Policy Platform on Biodiversity and Ecosystem Services, Brondzio, E. S.,Settele, J., D.az, S., Ngo, H. T. (eds). IPBES secretariat, Bonn, Germany. 1144 pages. ISBN: 978-3-947851-20-1
OECD, 2003. Environmental Indicators – Development, Measurement and Use. Report, Organisation of Economic Co-operation and Development.
Salafsky, N., Salzer, D., Stattersfield, A. J., Hilton-Taylor, C., Neugarten, R., et al. (2008). A standard lexicon for biodiversity conservation: Unified classifications of threats and actions. Conservation Biology 22:897911. doi: 10.1111/j.1523- 1739.2008.00937.x
Secretariat of the Convention on Biological Diversity (2020) Global Biodiversity Outlook 5. Montreal. 211 pages
United Nations Environment Programme. (2012). Global environment outlook GEO 5: Environment for the future we want. Nairobi, Kenya: United Nations Environment Program.
UN Environment (2019). Global Environment Outlook – GEO-6: Healthy Planet, Healthy People. Nairobi, Kenya. University Printing House, Cambridge, United Kingdom, 745 Pages.
World Economic Forum, 2020, Nature Risk Rising: Why the crisis engulfing nature matters for business and the economy, Geneva, Switzerland, 36p,
WWF (2020) Living Planet Report 2020 - Bending the curve of biodiversity loss. Almond, R.E.A., Grooten M. and Petersen, T. (Eds). WWF, Gland, Switzerland
Availability of Indicators
Our scientific network
- 60+ global corporations
- 50+ government bodies
- 30+ non-governmental organizations
- 25+ academic & research institutions