Earth Knowledge Cities

Reveal climate & nature change impacts on urban areas.
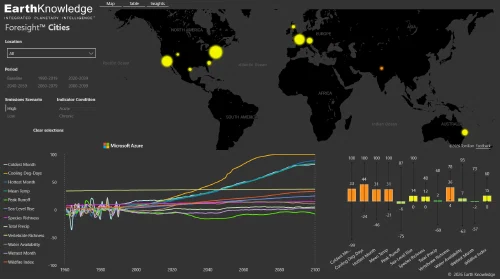
A simpler approach to understanding physical climate and nature risk.
Economical data options
Many of our early customers struggled with challenging budgets and resources and were looking for a cost-efficient, prepackaged solution covering populated cities.
By re-thinking traditional site-specific modeling approaches, we developed a new modeling technique representative of larger urban areas. Thus, Earth Knowledge Cities was born.
Best-in-class Science
Represent system-subsystem interactions
The planet is complex, too complex for simplistic probabilistic approaches. At the heart of our Earth Knowledge Cities solutions is a sophisticated platform that captures the intertwined relationships of Earth systems and their cascading impacts.
Earth Knowledge validates its models against more than a century of historical data and develops alternative future scenario projections from present day to 2100 based on society's response to climate and nature change.

Julia Armstrong D’Agnese, Earth Knowledge CEO
“The time is here. It is a critical advantage for every leader to be ready to confront climate & nature risk, regardless of the regulatory landscape. Earth Knowledge Cities enables you to take that first step with confidence and ease.”
Earth Knowledge Cities Packages

7500-WW
Specifications
Coverage: Worldwide. Data spans cities with populations exceeding 100,000 globally and those with populations of greater than 50,000 in North America, Europe, and Australia.
Metrics: 12 climate and nature indicators
Spatial Resolution: 1km (mean-score averaged across City, with exception to sea-level-rise.
Temporal Resolution: Decadal
IPCC Scenarios: SSP126 and SSP585
4000-NA
Specifications
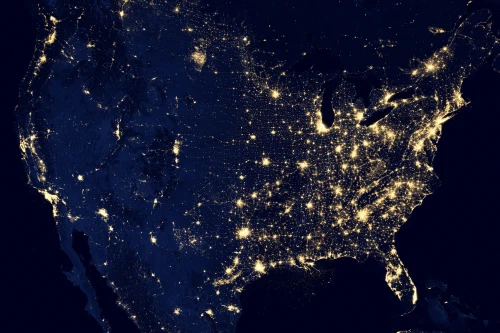
Coverage: North-America. Data spans cities with populations exceeding 20,000 in North America.
Metrics: 12 climate and nature indicators
Spatial Resolution: 1km (mean-score averaged across City, with exception to sea-level-rise.
Temporal Resolution: Annual
IPCC Scenarios: SSP126 and SSP585
4000-EU
Specifications
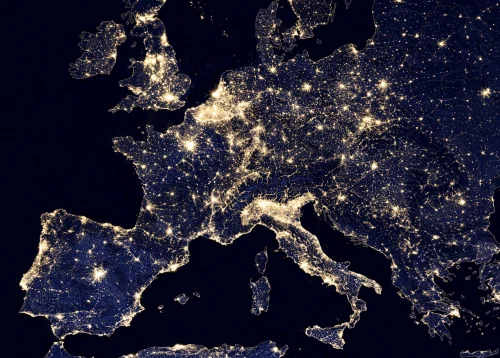
Coverage: Europe. Data spans cities with populations exceeding 20,000 in Europe.
Metrics: 12 climate and nature indicators
Spatial Resolution: 1km (mean-score averaged across City, with exception to sea-level-rise.
Temporal Resolution: Annual
IPCC Scenarios: SSP126 and SSP585
What’s included in Earth Knowledge Cities?
Global to local datasets
Our datasets cover over 20,000 global cities, towns or urban areas. Regardless of the geographic scope, every package includes a defined number of locations with set spatial and temporal resolutions, indicators, SSP’s and more.
Access to ad-hoc analysis
Certain locations may be subject to more extreme change than others. As an Earth Knowledge customer, you’ll have access to a team of specialists who can assist with focused assessments at local to regional scale.
Up to 40,000 individual data points per City
Powered by Earth Knowledge Twin, a Cities dataset delivers anywhere from 200-40,000 individual metrics per location. If you’re unsure which dataset works best for you, our climate experts will be happy to help.
ESG disclosure data
Our data and accompanying support documentation is designed to align with the requirements for customers undertaking ESRS, CSRD, TCFD, TNFD, CA-SB 261 and other regulatory disclosures.
Indicators
Coldest Month: Average minimum temperature during the coldest month Cooling Degree Days: Energy required to cool a building based on temperature above a daily threshold Hottest Month: Average maximum temperature during the warmest month Mean Temperature: Annual average temperature Peak Runoff: 99th percentile of monthly runoff, calculated over the previous 10 years Sea-level Rise: Relative sea-level rise as of 1993 baseline Species Richness: Estimated percentage of original (pre-development) diversity of all animal and plant species Total Precipitation: Total annual precipitation Vertebrate Richness: Estimated percentage of original (pre-development) terrestrial species remaining Water Availability: Total amount of water that is available for use Wettest Month: Total precipitation during the wettest month Wildfire Index: Accumulation of years in which the drought index is combined with high plant productivity (fuels)
Flexible purchasing options
Earth Knowledge offers an array of procurement options to meet different needs. From regional datasets to regularly updated visualization platforms, Earth Knowledge has a package for your budget and usage frequency.
Access to the Earth Knowledge Base
Our comprehensive learning environment is designed to help users with little or no knowledge of physical climate and nature risk take full advantage of our best-in-class data. Understand sector-specific approaches, and learn more about underlying methodologies, data sources and more.
IPCC Scenarios
SSP126 (low GHG emissions): CO2 emissions cut to net zero around 2075 SSP585 (very high GHG emissions): CO2 emissions triple by 2075
Exposure Scores
Earth Knowledge Indicators are calculated as exposure scores on a standardized scale of -100 .. 100, with -/+ signaling the direction of change. Indicator hindcasts and projections are modeled using core climate measurements that have been collected from the early 1900s. Exposure scores represent magnitude change from selected baseline conditions. The common baseline period is 1960-1989 except where noted.
Our climate & nature partners